
 READ HABITABLE’S NEW REPORT
Designing Out Plastics: A Blueprint for Healthier Building Materials
 Climate Change
Healthy Building Network (HBN) has often heard these two issues framed as a competition–a false choice. Instead, we know that these two powerhouses must work together for optimal results.
In 2022, HBN and Perkins & Will published a study highlighting building products that can do just that: optimize material health and lower their carbon footprint. This study identified key drivers and paths towards low embodied carbon and safer materials as well as when to consider and optimize both at the same time. To illustrate this point, we plotted an actionable path for project teams using flooring products as an example.
Team Low-Carbon Products: The embodied carbon of building materials contribute a whopping 11% to global carbon emissions.1 Most of these emissions happen before that product even gets installed. Additionally, the poorest countries and regions are those most impacted in terms of damage and loss of life by the effects of climate change.2 “That 11% might sound small compared with the impact of operational energy (28%), but for new construction, embodied carbon matters just as much as energy efficiency and renewables. That’s because the emissions we produce between now and 2050 will determine whether we meet the goals of the 2015 Paris climate accord and prevent the worst effects of climate change,” explains a BuildingGreen report.
Team Safer Materials: We spend 90% of our time indoors, and hundreds of industrial chemicals are found in our indoor spaces— in the dust, in the air we breathe, and in our bodies.3 The health impact of building materials are not limited to their time in use in the building, they often occur during manufacturing, installation, and at the product’s end of life. People living in close proximity to industrial facilities experience persistently worse air quality than average and exposure to industrial pollutants disproportionately impacts people of color.4 Another report suggests man-made pollution has exceeded the Earth’s safe operating boundaries.5 “Transgressing a boundary increases the risk that human activities could inadvertently drive the Earth System into a much less hospitable state, damaging efforts to reduce poverty and leading to a deterioration of human wellbeing in many parts of the world, including wealthy countries.” Professor Will Steffen, researcher at the Centre and the Australian National University, Canberra.6


Reducing toxic chemical use and the emissions associated with building materials NOW is a vital sustainability strategy for any project team.
The Research:
To identify the key drivers of embodied carbon and the key opportunities to reduce embodied carbon for each product type we read Environmental Product Declarations (EPDs), reviewed literature and data compilations, and conducted manufacturer interviews. The hazards associated with flooring products, the chemicals used to make those materials and the hazards associated with the chemicals used to install those products were collected using InformedTM product guidance and hazard data in the Pharos database.
Embodied Carbon:
Our research concluded that flooring products’ embodied carbon impacts are mostly associated with the raw material supply. The biggest opportunities to reduce embodied carbon in flooring comes from choosing a different product type that uses less impactful raw materials as well as products with longer service life. Carpet was consistently the most impactful product type due in part to its short service life. Plant-based flooring products, such as wood and natural cork, were consistently the least impactful.
Material Health:
Not surprisingly, the biggest opportunities to avoid chemicals of concern in flooring come from choosing a product type with typically fewer chemicals of concern. Products made from plastic, such as vinyl, nylon, or polyurethane tend to use more hazardous chemicals during manufacturing, installation, use, and end of life, than mineral or plant-based products. Selecting a product that is yellow or above in InformedTM color ranking Flooring Guidance, such as wood or linoleum, or even a non-vinyl resilient flooring will minimize the use of hazardous chemicals. Products in the red zone such as vinyl and carpet, should be avoided.
Conclusion:
When we looked at the opportunities to improve embodied carbon and improve material health for flooring we found that they were largely complementary.
These findings highlight the importance of pre-emptive design. Parallel to the way we conduct early modeling for energy or water use, the industry needs to model for embodied carbon and material health. A materials modeling approach–where the entire team is engaged early – before design development or construction development – will enable educated decisions before the design is set. Use HBN’s Embodied Carbon and Material health in Flooring and Drywall report and tools like Informed™ and the Carbon Smart Materials Palette to select typically healthier, low-carbon building product options.
 Pollution
Insulation selection has generally focused on prioritizing a product’s ability to reduce greenhouse gas (GHG) emissions from building operation, though increasingly considerations include GHG emissions from a material’s life cycle, from manufacture through disposal (known as embodied carbon).
However, this singular focus on GHGs fails to account for other harmful emissions associated with the life cycle of these materials, including toxic pollution that disproportionately burdens Black, Indigenous, people of color (BIPOC), and/or low-income communities. As billions of pounds of new insulation is being installed in buildings each year, failure to address these toxic impacts will mean that building decarbonization efforts will further entrench environmental injustice.
Healthy Building Network (HBN) joined NRDC and Energy Efficiency for All in an analysis of the life cycle chemical and environmental justice impacts of two popular building insulation materials—fiberglass and spray polyurethane foam (SPF).

The analysis found that both SPF and fiberglass release pollution into BIPOC communities over their life cycles, but SPF carries a much heavier pollution burden. The combined population surrounding the facilities that manufacture the key ingredient of SPF has almost double the percentage of Latino people compared to the U.S. overall. These facilities reported releasing an average of about 560,000 pounds of related hazardous chemicals every year and have a history of noncompliance with EPA regulations. Our previous research also found that spray foam has significant hazardous chemical concerns during installation and use in buildings.
Regarding embodied carbon, while the specifics vary, studies (such as here, here, and here) consistently show that closed cell SPF has significantly higher embodied carbon per R-value than fiberglass insulation. Further, SPF is made from almost entirely fossil fuel-derived inputs, with no recovery, reuse, or recycling of the material—necessitating continued extraction and refining of fossil fuels to produce this insulation product. Overall, comparing material health, environmental justice, and embodied carbon impacts between SPF and fiberglass, fiberglass is preferable on all accounts.
However, fiberglass manufacturing still releases hazardous pollution into communities who are disproportionately BIPOC and/or low income, and many fiberglass facilities have exhibited regular noncompliance with EPA regulations. Fiberglass manufacturers can reduce and eliminate such pollution by using less hazardous chemistries. For example, all four U.S. manufacturers reported reduced releases of formaldehyde by changing to safer binder formulations for many of their products between 2002 and 2015.
Why It Matters
As laid out in the Equitable and Just National Climate Platform:
“To achieve our [climate] goals, we will need to overcome past failures that have led us to the crisis conditions we face today. Past failures include the perpetuation of systemic inequalities that have left communities of color, tribal communities, and low-income communities exposed to the highest levels of toxic pollution and the most burdened and affected by climate change. The defining environmental crisis of our time now demands an urgency to act. Yet this urgency must not displace or abandon the fundamental principles of democracy and justice…Unless justice and equity are central components of our climate agenda, the inequality of the carbon-based economy will be replicated in the new economy.”
To truly be part of a just and equitable transition to a clean economy, climate solutions like building insulation must advance the well-being of BIPOC and low-income communities. We recommend that embodied chemical and environmental justice impacts drive material decision-making on par with consideration of GHG emissions.
Your Action Today = Healthier, More Just Future
In general, there are significant opportunities to improve the life cycle of building insulation materials through avoiding hazardous chemicals, implementing circularity, and taking other actions stemming from the principles of green chemistry and environmental justice.
Manufacturers and policymakers should advance transparency about what is in a product, how and where it is made, and the hazardous releases that occur throughout its life cycle. In the meantime, those who choose building materials can start by avoiding hazardous chemicals in a product’s content to help protect not only building occupants and installers, but also others impacted by those hazardous chemicals throughout the supply chain. Our InformedTM product guidance can help you choose safer materials.
All stakeholders–including manufacturers, policymakers, and those who choose building materials–should support the leadership of frontline communities and make changes to their own practice so that all families have healthy places to live, learn, work, and play.
 Health
We have been picking on plastics a lot recently (see articles: Addressing the Plastic Crisis: Why Vinyl Has to Go and The Illusion of Plastic Recycling: Neither Just Nor Circular). This is because we believe that typically the best way to avoid hazardous chemicals is to avoid plastic altogether. With this said, we recognize plastics in buildings are currently ubiquitous (see article: Our Plastic Buildings: A New Driver of Fossil Fuel Demand).
So, let’s consider what would need to happen for plastic building products to be considered truly sustainable. Can the plastics industry do better? What are the key opportunities today to do so, and what global policy tools could promote these opportunities? These are among the key questions HBN explored in the development of a pair of case studies for the international Organization for Economic Co-operation and Development (OECD) as part of the Inter-Organization Programme for the Sound Management of Chemicals (IOMC).
Before we jump into the case study findings, first, let’s define plastics. For the purposes of this article, we define plastics to be any polymeric material, fossil fuel based or bio-based. The case studies focused on durable plastic goods, using building materials as an example.
The case studies explored both plastic flooring and plastic insulation with the goal of increasing awareness of environmental and human health impacts of plastic product production at each stage of the lifecycle and proposing policy interventions that can help move the industry toward more sustainable plastics products in general.
In the report, we created a framework for evaluating what a truly sustainable plastic product would look like. These goals are lofty, and currently no existing plastic building materials meet these goals. However, they provide a pathway towards truly sustainable products.
To be considered a sustainable plastic, a product would have to enhance human and environmental health and safety across the entire product life cycle. It would have to be managed within a sustainable materials management system, and would have to meet the following goals:
The case study explores trade-offs that exist between different material choices.
For a flooring example, a product that is designed to use adhesive to install is typically thinner than one that uses a click tile system to install. These thinner products use less material per square foot and therefore have less chemical impacts associated with manufacturing and less waste at the end of life. However, adhesives may add hazardous substances to the product installation stage. By moving from a click tile product to a glue down product, chemical exposure burdens shift from manufacturing and end of life to the installation stage and use phase.
For an insulation example, a product that is designed to chemically react at the build site, such as spray polyurethane foam (SPF), can allow the insulation to form an air-sealed custom fit. However, SPF is not recyclable, and adherence of that insulation to surrounding materials may also make those materials more difficult to reclaim or recycle. Moving from XPS, EPS or polyiso to SPF may reduce the ability of other surrounding materials to “have a commercial afterlife” in the pursuit of an added performance feature.

Building awareness around these trade-offs enables stakeholders to make informed choices.
Now, back to reality after crafting the characteristics of a theoretical sustainable plastic. The bottom line is that there are no sustainable plastics that exist today, and we are a long way off from that day. Today, project teams need to prioritize which sustainability goals are most important and how to deal with real and significant gaps in understanding and/or data.
The case studies compared only product types made of plastic, but in reality, project teams have a wider variety of materials to choose from in any given product category. HBN’s Product Guidance considers the most commonly used product types within a product category and ranks those product types relative to one another from a chemical hazard perspective. Product types made of plant-based materials or minerals tend to rank higher than plastic products. You can apply the same sustainability goals proposed in this article to non-plastic products.
In project design, the biggest leaps towards more sustainable products from a chemicals perspective often requires consideration of vastly different materials versus making incremental improvements in chemistry for a particular product type. For example, this could mean moving from vinyl to linoleum flooring versus attempting to select the least bad vinyl option.
Check out the full flooring and insulation case studies for examples of how to use these goals to consider and choose the variety of plastic product types you will inevitably be specifying for your next project. Alternatively, challenge yourself to skip the plastics whenever possible. Even selecting one non-plastic product is cause for celebration. Make the swap!
 Equity
This chapter in ILFI’s book The Regenerative Materials Economy explores the often overlooked life cycle chemical and environmental justice impacts of building materials, focusing on insulation materials like fiberglass and spray polyurethane foam (SPF).
Through a framework rooted in green chemistry and environmental justice principles, authors Rebecca Stamm of HBN and Veena Singla of NRDC analyze manufacturing realities, environmental justice concerns, and environmental health impacts, providing recommendations to improve the industry’s sustainability and reduce the negative effects on marginalized communities.
 Health
This Women’s History Month, we’re celebrating an incredible leader in the green chemistry and healthy materials space: our very own Teresa McGrath! Teresa is Habitable’s Chief Research Officer, leading our research strategies.
Prior to working at Habitable, Teresa led the Chemical Management Program for Sherwin-Williams, the largest paints and coatings company in the world, where she focused on hazards reduction and transparency and assisted business units in meeting sustainability and green chemistry goals. She also spent nine years as the Senior Managing Toxicologist at NSF International’s Green Chemistry Programs, and two years at the Environmental Protection Agency in the Design for the Environment (DfE) Branch of the Office of Pollution Prevention and Toxics (OPPT).
We caught up with Teresa to learn why she’s a champion for safer chemicals and healthier products and to get her perspective on the industry today.
HABITABLE:
What got you interested in working in sustainable products and clean chemistry?
TERESA MCGRATH:
It all starts with my family. Specifically my father – who would never identify as an environmentalist – but through his actions taught me to care for those who are most vulnerable and to take care of our planet. For example, more than once I witnessed my dad giving CPR to an injured animal that one of our dogs had mangled. In grade school I disgusted my friends by pulling carrots out of a peanut butter and jelly coated baggie my father had reused (this was before reusable bags were a thing!).
In college I did a research project on how to remove pesticides from drinking water using a biocatalytic filter method. It took me until the end of the project to ask myself “Wait, why is this pollution in our drinking water to begin with? Why are we using chemistry in such an inefficient, clumsy way?” After a little digging I stumbled on the Twelve Principles of Green Chemistry, authored by Dr. Paul Anastas and Dr. John Warner. These principles are centered around using chemistry to prevent pollution rather than create it, to make efficient use of resources down to every atom, to avoid waste. This was an inspiring moment for me.

I decided to pursue a graduate degree in chemistry that focused on Green Chemistry. At the time the only graduate program focused entirely on “Clean Chemical Technology” was in the U.K. at University of York. Off to England I went, and I have worked in the field of Green Chemistry for my entire career.
H:
What has surprised you the most about working in this field?
TM:
I have worked in government, NGOs, and industry. I think what is surprising is how much these stakeholders have in common and how most people want the same things when it comes to human health and the environment. Most people want (to make, use, or buy) safer products that work well and they can afford. It is this alignment that we can all use to make progress.
The most exciting projects in my work experience were those that harnessed input from different stakeholders with different perspectives. For example, in 2017 Valspar invited NGOs and academics who fought against the use of the endocrine-disrupting chemical bisphenol A (BPA) to help them design and test alternatives to BPA for use in food packaging.
We can all learn from each other, and these moments of collaboration are critical to enable market changes toward products that are safer for human health and the environment.
H:
Who has inspired you along your journey?
TM:
In addition to Dr. Anastas and Dr. Warner, I am grateful to Dr. Lauren Heine, who I met at a Gordon Green Chemistry conference when I was in graduate school and has been a friend and mentor to me ever since. Dr. Heine is a leader in the field of green chemistry, green engineering, and sustainable business practices.
I first met Lauren when she was the Director of Applied Science at Green Blue Institute, where she developed the CleanGredients database in partnership with the U.S. Environmental Protection Agency (EPA) to help cleaning product manufacturers find safer alternatives. At Clean Production Action, she co-authored and led the development of the GreenScreen for Safer Chemicals, a method for comparative chemical hazard assessment. She has also worked as Director of Science and Data Integrity at ChemFORWARD, where she co-created a harmonized chemical hazard assessment methodology that will not helps people avoid chemicals of concern, but also identify safer alternatives. She serves on various advisory boards and committees all over the world to share with the rest of the world a bit of the brilliance whenever she can.
Lauren taught me that collaboration is one of the most important tools to inspire change. She has an unique ability to build connections and relationships with every project she is involved with. I aspire to approach my work with this same focus.
I also credit Lauren with helping me land my very first job out of graduate school at the EPA despite the fact that I handed her a printed resume on scented paper (long story!).
H:
What are you excited about?
TM:
When I talk to project teams about how they find and select healthier products for new construction or retrofits, I often hear that they rely on disclosures like Health Product Declarations (HPDs) or Declare labels, or ecolabels such as Greenseal or Cradle to Cradle certifications, or most often they rely on manufacturer claims about the product.
I’m feeling optimistic that there has been more traction with manufacturers using these great transparency programs. There are a limited number of products on the market today that carry disclosures, and even fewer that have ecolabels. Real estate teams often feel stuck when the product they want to select is not yet disclosed. Also, because a product carries a disclosure or an ecolabel does not mean it is the best choice to avoid hazards for that product category.
I believe that there is a lot of value in disclosures and product certifications and that they play a critical role in our ecosystem. And, I believe the most powerful way to achieve safer products is to start BEFORE relying on those product disclosure tools. Project teams can take advantage of product type guidance to select products that are typically safer than others – all before ever selecting from an individual manufacturer.
Habitable’s InformedTM product guidance is informed by our 20+ years of building materials research. Guidance for individual product categories are generated by analyzing everything we know about a product category, including the way the products are made, the hazards associated with the product content, and end of life options for different product types. The reason I am so excited about this resource is that it summarizes a LOT of technical information into a simple, easy to use format that can be applied easily to both benchmark current practices and select typically safer products for projects, and even help document the powerful impacts of choosing safer materials on a project.
H:
What advice do you have for up-and-coming leaders in this space?
TM:
Don’t be afraid to reach out directly to professionals to learn more about their jobs. Ask what experience they are looking for in candidates, what their day to day looks like, and even directly ask about open positions or internship opportunities. Once you are in a role, actively look for opportunities to meet people within and outside of your organization. By expanding your network you learn different perspectives and build your capacity to collaborate on your next project. I can say from experience that you can make an impact from many different vantage points. We need young energetic leaders in NGOs, government, industry, and academia who are passionate about making the world a better place!
HealthHealthy Building Network (HBN) is excited to welcome Monica Nakielski as our new Board Chair!

“I was excited to join an organization having the impact that HBN does. Our influence and impact spans across industries and the globe with the science and resources we create,” Monica said. “I was interested in networking with other leaders in this space while contributing to the conversation and bringing a healthcare perspective to the table.”
A longtime champion of healthy buildings and spaces, Monica is the former Vice President of Sustainability at Advocate Aurora Health. She has over 15 years of experience as a sustainability practitioner and consultant to Fortune 500 organizations, governments, institutions, and nonprofits, with a focus on health care, hospitals, and health systems.
Monica has long had a passion for healthy materials. Traveling to her mother’s home country of Ecuador years ago, she was deeply impacted by the visible effects of industrial processes and pollution. It was clear that in those communities – like many in the US and around the world – it was the already marginalized communities who were bearing the brunt of the impact of our choices.
Monica first connected with HBN in 2011 at a BizNGO gathering, where she began to learn about the deeper connections between health and the built environment and the way business and product decisions can deeply impact both. She quickly became an advocate for healthier materials and joined the HBN board in 2019.
A commitment to create healthier spaces for patients, staff, and communities has shaped Monica’s career for more than a decade. Before joining Advocate Aurora Health, she served as the head of sustainability at Blue Cross Blue Shield of Massachusetts (BCBSMA), where she and her team worked to influence health insurers to be leaders of environmental sustainability. She also led and managed sustainability at MassGeneralBrigham (formerly Partners HealthCare) across 16 facilities and 18 million square feet.

As a leader in sustainable healthcare, Monica has been a vocal advocate for integrated approaches to creating safer and healthier spaces. She pushes back against the false dichotomy many practitioners feel of having to choose between climate or chemicals – i.e., focusing on energy efficiency or low-carbon choices versus eliminating toxic chemicals from products and the supply chain. She believes that both approaches can and must be aligned and integrated to create truly healthy spaces for all.
One of her proudest successes was impacting the amended fire code while working for a healthcare system in Boston in 2013. She had the opportunity to advocate with the Boston City Council to ensure that the new fire code met both public safety and public health needs. They were successful in removing toxic flame retardants from the requirements, which directly impacted the administrative headquarters they were building at the time. For that project, Monica’s team was successful in ensuring that more than 70% of the materials used in the building interiors avoided the worst chemicals of concern.
Monica is committed to blazing a trail and bringing others along for the journey. “We are able to drive this cultural shift and change, all the way down to selecting healthier, safer products, while we’re assuring the same, if not better health outcomes,” she said. “It comes down to connecting with our colleagues and educating them – finding the stories and the information that will inspire them to act.”
Monica believes that HBN is well-positioned to lead this work and create a healthier, more just world. “It’s up to us to lead, to share, to continue to collaborate, network, and leverage the science, tools, and resources that HBN publishes.”
Monica is incredibly excited for the growth and expansion that HBN is poised to take on in the coming years, and we are fortunate to have her as a leading voice guiding the way.
“What I find most exciting is that these discussions are bubbling up everywhere. With new ESG reporting standards and rules, people are being held accountable. I love the idea of continuing to raise awareness and drive perception, tying it back to the science. For people who have worked in the space of sustainability, we have waited for a really long time for people to connect the dots and to get as excited about this work as we are.”
We are grateful for Monica’s leadership and commitment to helping us achieve our vision that all people and the planet thrive in a world free of toxic chemicals.
“I want to leave the world a better world for my kids, and their kids, and the generations that follow,” she said. “I think we all do.”
Climate ChangeThe idea of a “plastic building” might bring to mind Barbie DreamHouses or Lego towers, but probably not the real life spaces we occupy every day. However, plastics have a long history of use in construction and are increasingly being used in a wide variety of building products.
What are plastics?
Plastics are synthetic or semi-synthetic materials typically made from fossil fuels and their byproducts.1 Depending on the plastic’s intended use, they may also be combined with a variety of additives such as stabilizers, fillers, reinforcements, plasticizers, colorants, and processing aids, many of which are toxic chemicals that are linked to chronic disease. They are a material of choice in the built environment, however, they come with a host of deeply rooted problems.
Durable plastics are the new “frontier”
As the energy sector shifts away from fossil fuels, the fossil fuel industry has turned toward plastics as a way of maintaining demand for their products.2 An International Energy Report from 2018 showed that petrochemicals, which are used to make plastics, are slated to become the largest driver of global oil demand in the near future.3 Historically, much of the investment has been in single-use plastics, which are increasingly the focus of bans, restrictions, regulations, and product innovation due to their harmful environmental effects.2 To pick up this anticipated slack, petrochemical, fossil fuel, and plastics industries are now pushing to increase their market growth in more durable goods, like building materials.4 The building and construction industry is already the second largest consumer of plastics after packaging.5
Plastics contribute to climate change
Plastics contribute to greenhouse gas emissions at every stage of their lifecycle. Greenhouse gases are released during fossil fuel extraction, transport, feedstock refining, and plastic manufacture, and carbon is released into the atmosphere through degradation and incineration at plastic products’ end of life.6 A 2019 Center for International Environmental Law report concluded that these lifecycle emissions may make it impossible to keep global warming below 1.5 degrees if growth continues as projected.6 Any comprehensive climate change plan must curb the production of plastics.
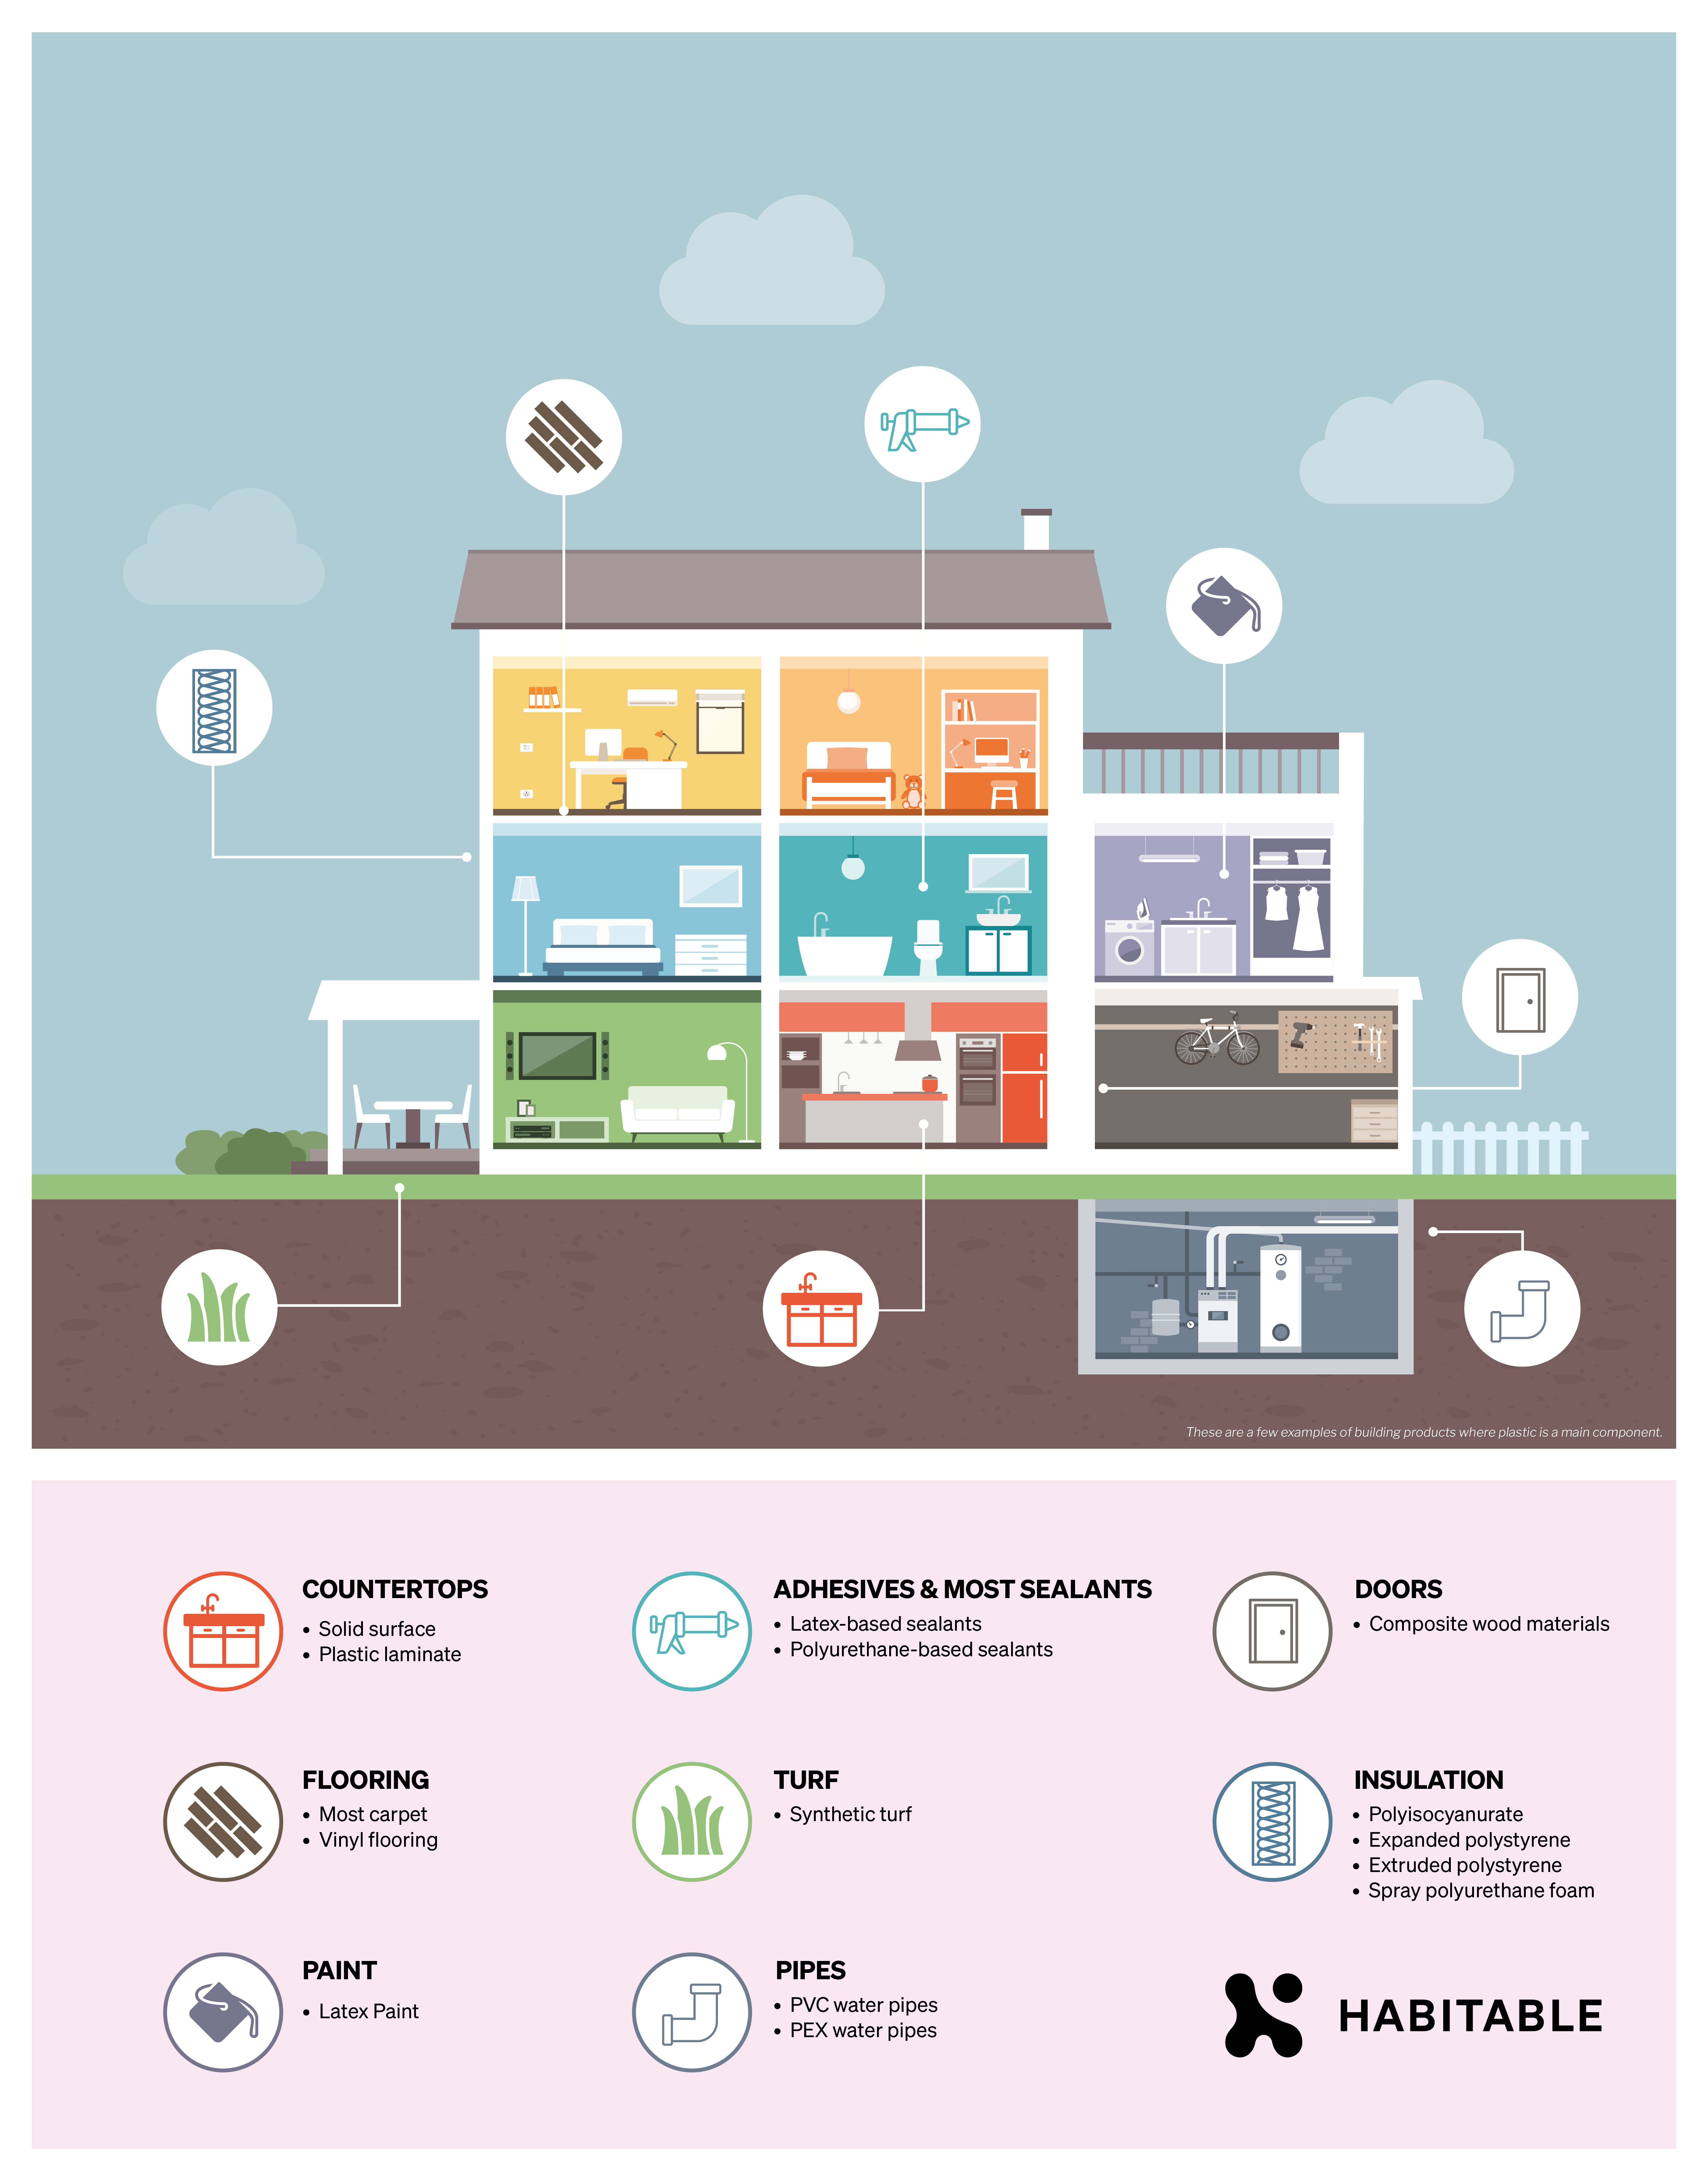
Plastic is ubiquitous in buildings
Maybe you know that vinyl flooring is plastic, but did you know that latex paint is mostly plastic? That many insulation products are plastic? How about carpet? Plastic-containing products can be found in almost every part of a building, from the waterproofing on foundations to roofing materials. See below for an infographic showing just some of the plastic materials in an average home. The products included are not exhaustive, but rather a list of example product types from Habitable’s InformedTM product categories where a main component is plastic. There are many more products that are predominantly made of plastic, and even more that contain smaller amounts of plastic additives or plastic binders.
Our plastic buildings are driving the growth in fossil fuels at the same time as we are diligently working to incorporate clean energy solutions and decarbonize these very same places.
Hidden costs of cheap plastic
Plastic products are often favored due to their “low cost.” This low retail cost is achieved by avoiding and externalizing the costs of fossil fuels and industrial pollution – and their related chronic diseases – throughout the plastics supply chain. These externalized costs are real and paid for by the BIPOC and low-income communities across the nation who are disproportionately burdened with toxic pollution flowing from refineries, chemical manufacturing, and plastics plants. It is fair to say that most of the stories about environmental justice that you have heard can be linked to plastics manufacturing.

With the building and construction industries anticipating growth over the next several years,7 commensurate growth is to be expected in their use of plastics. Indeed, market trends and projections show a steady increase in polyvinyl chloride (aka vinyl), polystyrene, polyethylene, polyurethanes, and other plastics used in building materials.8
It is, of course, unrealistic to avoid all plastic in building materials at this time, but there are steps we can take to reduce plastic waste, decrease toxic chemical use, and curb the demand for fossil fuels.
Select Better: Avoid worst-in-class plastics where possible.
Prioritize Transparency: Prefer products that provide transparency
Aim for Circularity: Select products designed for recycling.
With all of these plastic products, our buildings may seem increasingly like Barbie’s DreamHouse and a climate nightmare, but as specifiers, designers, architects, contractors, and owners we can do much to control what products end up in our projects. Starting with the recommendations above, we have the power to influence demand for better and safer materials. In the case of plastics, choosing better materials can lead to less reliance on fossil fuels, fewer greenhouse gas emissions, a decrease in toxic chemical use, and a win for our changing climate.
Health
Simona Fischer, MSR Design
As registered architect, sustainable design professional, and associate with MSR Design, Simona Fischer has spent much of her career thus far developing and testing strategies for integrating sustainable design into the workflow of architectural practice. Her experience includes project management, Living Building Challenge documentation, and firmwide sustainable design implementation.
Simona is a dynamic community of practitioners who help co-create solutions to accelerate the adoption of healthier building materials in affordable housing. She has presented at national conferences, lectures regularly at the University of Minnesota, and currently co-chairs the AIA Minnesota Committee on the Environment (COTE).
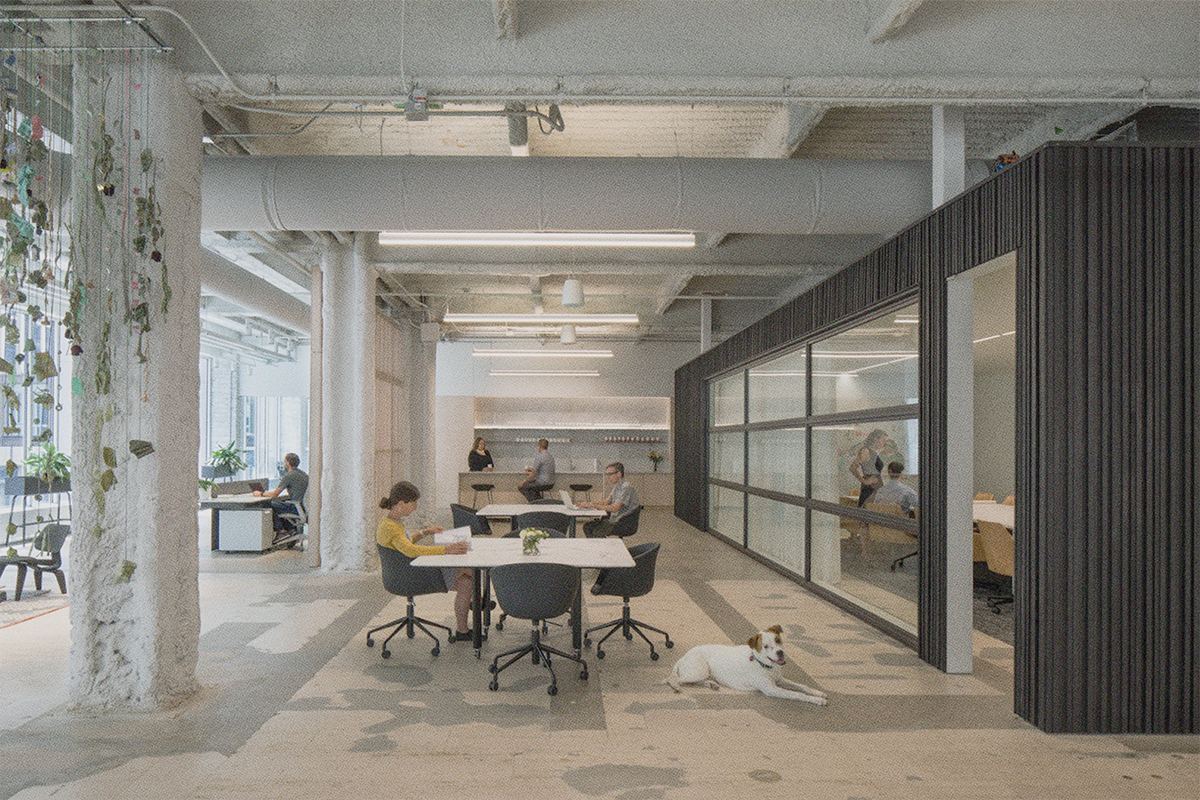
Simona was instrumental in the Living Building Challenge Petal Certification of MSR Design’s new downtown Minneapolis headquarters, which achieved the materials, beauty, and equity petals. The project incorporated more than 114 Red List Free materials and achieved a 28 percent reduction of its embodied carbon footprint by using salvaged materials. She also led the development of guidelines around transparency, sustainability, and health for the firm’s materials library, including training materials for staff and external sales reps.
We sat down with Simona to learn why materials have been a focus of her career and to get her perspective on the green building industry today.
What sparked your passion about healthier materials? Was there an “aha” moment or a time that something just clicked?
I was that kid who won a prize for designing the elementary school recycling banner, so I guess I’ve cared about materials for a long time. But my interest in building materials was piqued in architecture school, when we were challenged to create a new ecolabel. Faced with inventing a way to compare one material to another in terms of sustainability, I realized how mind-blowingly complex of a task that was. How do you make the criteria objective? How do you compare products across categories? How do you measure health – is it just by the list of ingredients, or do you include research on health outcomes factoring exposure and risk (and if so, what research even exists)? How do you stack human health and other metrics against each other and choose which factor outweighs the other? How do you account for performance and durability? The questions were endless and led to more questions, which I found complex and intriguing. In other topic areas like water and energy in buildings, the goal seemed straightforward (at least on the surface). Use less energy, and make it cleaner. Use less water, and make it cleaner. But with materials, the number of variables were infinite. We had to think about balancing not just toxicity to people and embodied carbon, but also harvesting of raw materials, ethical manufacturing, and what to do with all that stuff at the end of its useful life.
I ended up writing my MS thesis on methods for assessing sustainability at the level of the manufacturer, as opposed to focusing solely on individual products which change so frequently. I was really just trying to find a system map at a higher level, and make the big, shifting world of materials more manageable in my head. I still use some of what I learned during that project as indicators of whether a building product manufacturer is serious about human health and sustainability, or just greenwashing. But sometimes they are greenwashing because they don’t know any better, and they are on their way to improving. So you can’t just write off smaller companies who don’t yet have all the documentation. It’s a learning process for them as well.
At MSR Design, the conversation about healthy materials had already started when I joined to work on The Rose, a Living Building-inspired affordable housing development in Minneapolis. My colleagues Rhys MacPherson, Paul Mellblom, and Rachelle Schoessler-Lynn were leading the conversation about why we should, and how we could, avoid vinyl and other chemicals on The Rose and on other projects across the firm. Over the next couple years we held a number of all-staff discussions and training sessions on healthy materials. Many staff members, from seasoned designers to interns, became interested in the question of how we could do better while still delivering a beautiful aesthetic and the best functionality for our clients. By the time we were ready to start designing our new studio, healthy materials as a concept had had enough time to become embedded in the culture
Tell us about your project to build the new MSR studio. Why was it important to prioritize healthy materials for this project? What went into your process?
When we knew we were moving, we held an all-staff discussion to debate frameworks for certification. We considered LEED, WELL, Fitwell, and Living Building Challenge Petal Certification. In the end, LBC won, because the Materials Petal was so ambitious, prioritizing not only human health through the use of Red List Free products, but also environmental health and other butterfly-effect impacts of resource harvesting and global warming potential and waste. At the same time, the LBC path included an emphasis on equity, as well as using the project as a tool to educate and inspire others. We found the holistic approach inspiring, and appreciated the challenge (most days).
It was important to prioritize healthy materials because we knew our staff cared about living out our values around healthy indoor environments. I think the team will agree that meeting the Red List requirement was difficult. It took time to develop a workflow for gathering the documentation. But it also gave us the opportunity to rethink the way we approach materials from the start of projects. Instead of trying to weed out all the “bad” chemistry, we found it was actually easier to start from scratch and build up a list of materials we knew were likely to comply with the requirement. It ended up being simpler, mostly natural materials, which we used as the palette for our space.
How do you consider low embodied carbon versus health in product selection?
Non-toxic materials and low embodied carbon are two lenses on a singular problem, which is planetary health. Human health is a subcategory of planetary health, since we’re part of the planet and made of its stuff. When indoor and outdoor environments, and plant and animal and human bodies, are polluted by toxic substances, both from human-made toxins and an overabundance of greenhouse gasses, the global ecosystem suffers and humans suffer within it. We are nature. What’s interesting is, younger, upcoming professionals and design students seem to understand this intuitively. They don’t even need to be told that human and global environmental health go hand in hand. So I think as an industry, we just need to accept the interplay of embodied carbon and human health as a foregone conclusion and get straight to the nitty-gritty of what materials we use and how those materials are grown, produced, manufactured and delivered.
That said, we also need to get serious about the data used to back up carbon and health claims. We need transparent, standardized reporting from manufacturers, including making sure the scope of every life cycle assessment (LCA) takes all the impact categories of the AIA Materials Pledge into account. I think petroleum-based building materials are going to be a battleground for a while to come. The low purchase price and saturation in the market make plastics seem like an easy choice for all kinds of different finishes and performance layers in buildings. It is possible to make them somewhat healthier for end-users by being careful to avoid certain additives. But that leaves a massive loophole; the impacts of production and waste on planetary health. I think there’s an opportunity for data to drive a new understanding here. If we can start seeing standardized collection and data crunching of environmental product declaration (EPD) data from different product sectors, we might be able to correlate carbon from building products more directly to regional health impacts of the production of those chemistries. This would help close loopholes that allow the incredible health impact of high global warming potential (GWP) emissions to stay hidden in the shadows
How have you used your knowledge to help move your clients toward healthier materials? What has been most successful?
I think some of my most successful work has been in addressing priorities and processes in our workflow. I can’t count the number of times I’ve heard people say they just wish there was a single, simple database of all the great products. There are ever-improving databases out there, but people always want something else that is missing, so the problem hasn’t been solved. I think the missing piece is a deeper understanding of the principles of product categories, such as knowing what different types–not brands, but general types–of insulation or countertop materials are made of, and where they come from. This level of knowledge, over time, becomes a kind of intuition one uses to filter the world of products even as new things constantly appear in your inbox or your lunch and learns. When you understand the principles, and don’t just rely on a database to provide a solution, it also gets easier to speak knowledgeably and make solid recommendations to clients.
On project work, I have the best luck when I’m upfront about why we need to consider material health alongside cost. You have to tailor your message to the audience, for example, some clients are most receptive to the idea of improving their impact on the world, whereas for others, the message that hits home is one of directly affecting their health or the health of people they care about
How has Habitable’s InformedTM building product research been helpful or influential?
I love InformedTMand recommend it to designers all the time, and clients too. The information is organized in terms of product categories as opposed to brand names or labels, so it aligns with the level of learning that I think is most beneficial to becoming smarter in practice. We used the sample specs to rewrite our paint specifications in 2021. We’ve also heard great lectures from Habitable research team members over the years that have left an impact on our staff.
What advice do you have for other AEC leaders? Are there processes or approaches you would recommend? Where would you recommend a newcomer to healthier materials start?
For designers, I recommend signing the AIA Materials Pledge and studying the categories. The Pledge is a great framework – if you address each of the Pledge categories in some way, you know you’re hitting the right bases. If you can, allot some time to staff education and discussion. I recommend the Living Building Challenge Materials Petal as a particularly inspiring framework for education and good discussion, because it is based on absolute goals, instead of relative improvement. The COTE Super Spreadsheet (downloadable on the AIA website) is a good starting point for addressing materials issues in an applied manner on projects.
At MSR Design, our internal education efforts led to the development of our Material Library Entry Criteria. If others want to design similar criteria for their libraries, they are welcome to copy ours outright or modify as needed: www.msrdesign.com/generative-impacts.
The more we as designers align in our message to manufacturers about health and carbon, the easier it becomes for them to stay in business while giving us what we want
What are you most excited about right now?
I’m excited about natural and biobased materials. On the high-tech side, there is so much opportunity for new materials to be developed, especially bio-based polymers. On the other hand, there is a new straw bale project that is being built in Minneapolis. It’s low tech in comparison to the latest research in biomaterials, and yet it combines healthy, natural materials seamlessly with low carbon construction. The team is using Passive House building science principles to build a durable system, which they will test with sensors in the walls over the next few years. I really resonate with the idea that we can build a sustainable future with natural materials in both high- and low-tech ways
What do you want other people to know?
We, as an industry, are practicing architecture and construction in an era where buildings are made of hybrid material systems so complex, we hardly know what’s in them or why they work. I think we architects can perhaps find evidence of the Vitruvian virtues of utilitas (utility) and venustas (beauty) in the work we produce, but somewhere as a profession, I think we have let go of the firmitas (stability). Not in the sense of solid structure, but in the sense of owning materiality and material knowledge as a critical aspect of an architect’s role. We have become accustomed to accepting a level of vagueness about assemblies and their tons of little components, and leaving the details to the product manufacturer. I think understanding materials deeply is about reclaiming this knowledge, and a piece of architecture we have lost
Thank you to Simona and MSR design for being leaders in healthier materials! To learn more about the MSR headquarters project, check out this case study. You can also learn more about MSR’s commitment to sustainable design and download their Sustainable Materials Action Packet on their website. Follow this link to learn more about InformedTM, product guidance which Simona mentions influencing her practice.
Equity
What do building materials have to do with social justice? Learn more in this article by Diana Alley, Avideh Haghighi, and Lona Rerickat at ZGF Architects.
Pollution
PFAS are used in paints, food packaging and even cosmetics. We know they are in our water, air, soil and bodies – but less about how they will affect us.